Rome: Timeless Charm Meets Modern Challenges
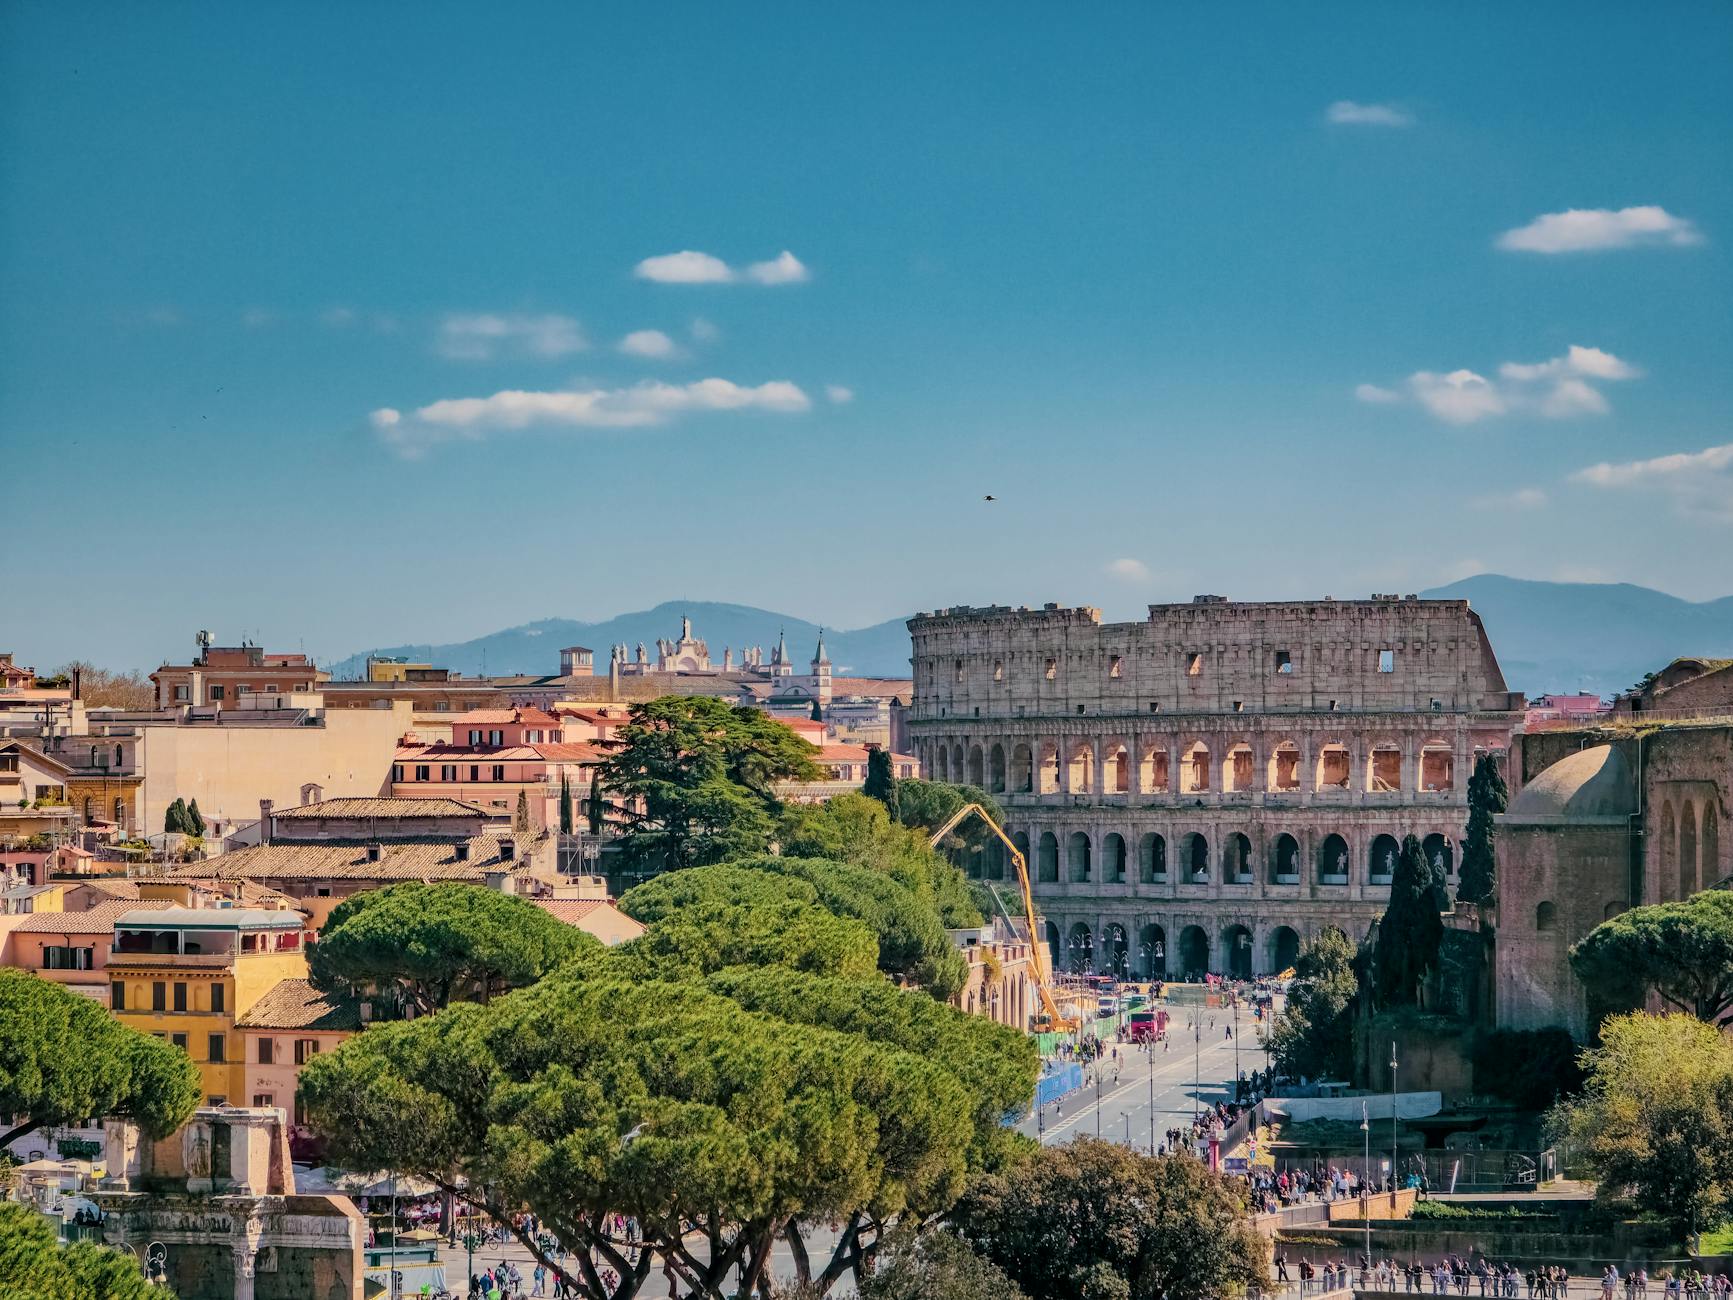
Rome, the capital of Italy, is renowned for its rich history and iconic landmarks such as the Colosseum and the Vatican. Located in the Lazio region, this ancient city blends classical architecture with vibrant modern culture. Rome is famous for its art, cuisine, and bustling piazzas that capture the essence of Italian life. Visitors and locals alike enjoy its unique combination of historical significance and contemporary charm.
Rome Key Statistics Overview
Rome Population Statistics
Rome's population in 2025 is 2,747,290, showing a decline of 2.2% over the past five years. This population trend contrasts with Naples, which experienced a growth of 4.2% during the same period. The city covers an area of 1,286 km², resulting in a population density of 2,136 people per km². Rome is 51% more spacious compared to other cities in its country, such as Naples and Milan, and 46% more spacious than the European average. This density indicates a low to moderate level, reflecting its transition into more suburban areas.
Population Over Time
Chart loading...
Population Density Over Time
Chart loading...
Rome Employment & Jobs Data
In 2023, Rome's unemployment rate was 8.4%, which is around the European average. However, the city's unemployment situation has been deteriorating faster compared to other Italian cities such as Naples and Milan, where the rates decreased by 44.1% and 34.9% respectively. This indicates that Rome is facing more challenges in reducing unemployment than these cities. The trend suggests a relative decline in job market conditions within Rome compared to its national counterparts. Overall, Rome's job market shows a need for improvement despite its average unemployment rate.
Unemployment Rate Over Time
Chart loading...
Activity Rate Over Time
Chart loading...
Rome Tourism & Visitor Statistics
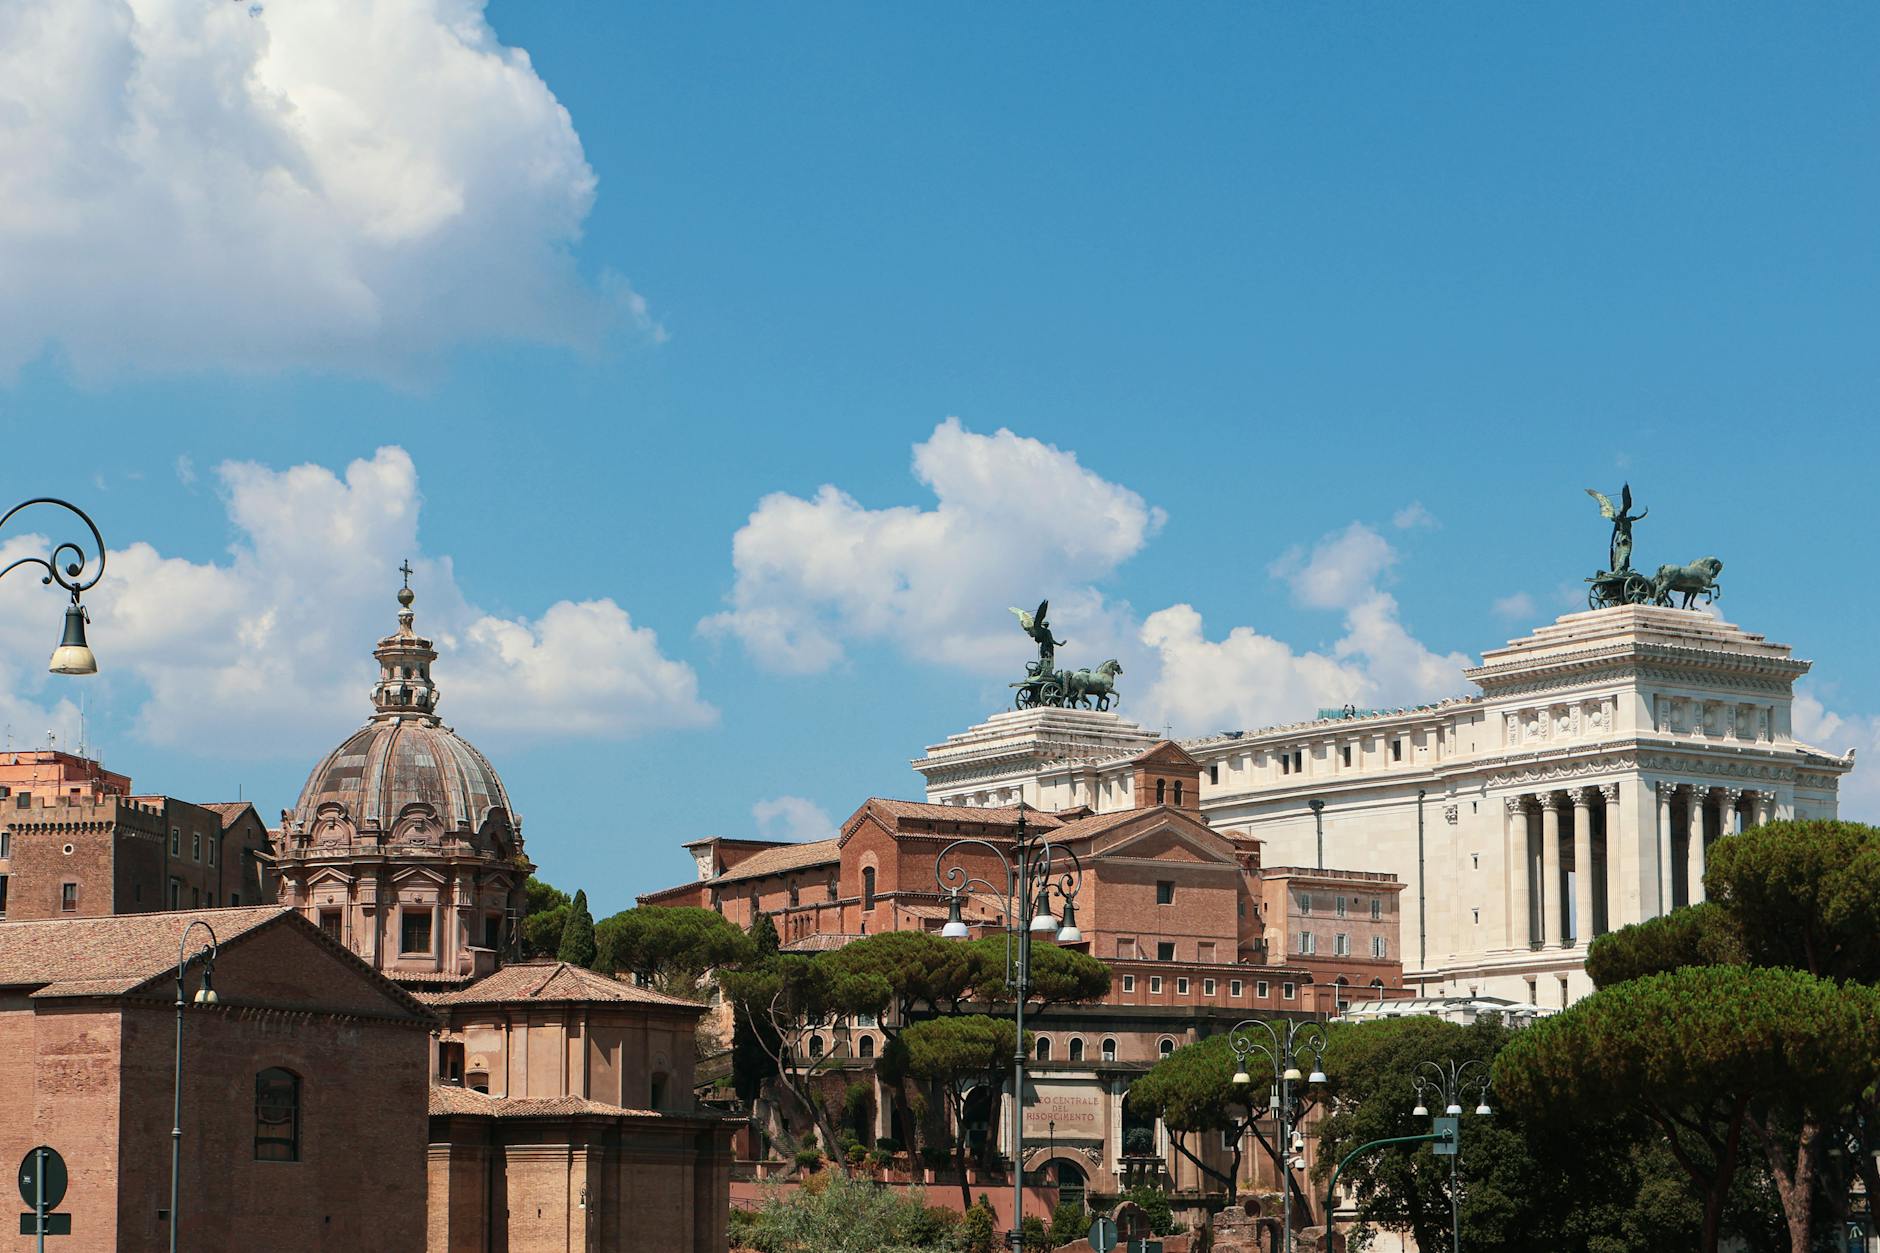
Photo by C1 Superstar on Pexels
In 2024, Rome recorded 42,705,319 tourism nights, indicating high tourism activity. This figure outperforms other Italian cities such as Naples by 43.3% and Milan by 39.2%. Compared to the European average, Rome's tourism nights are significantly higher, reflecting its strong appeal to visitors. The city's tourism metrics highlight its status as a leading destination in Italy. These trends demonstrate Rome's continued importance in the European tourism sector.
Tourism Nights Over Time
Chart loading...
Rome Environment & Air Quality Data
Rome's PM10 concentration in 2013 was 26.6 µg/m³, which is above the World Health Organization guideline but still within European Union limits. This level indicates that air pollution in Rome is a concern compared to the European average. The trend in Rome shows a faster deterioration in air quality than other Italian cities such as Naples and Milan, both of which reported no change in PM10 levels. This suggests that Rome's air pollution is worsening relative to similar urban areas in Italy. Overall, Rome faces environmental challenges related to particulate matter pollution.
Air Quality (PM10) Over Time
Chart loading...
Rome Statistics Summary
Rome stands out as a city where ancient history and vibrant modern life coexist, attracting millions of tourists annually and maintaining its status as a top European destination. Despite its spacious urban layout and rich cultural offerings, Rome faces challenges with a declining population, a rising unemployment rate, and worsening air quality compared to other major Italian cities. These factors highlight areas for growth and improvement amid the city’s enduring appeal. Overall, Rome remains a dynamic metropolis balancing its iconic heritage with contemporary urban pressures.