
Turin: Balancing Heritage, Innovation & Growth
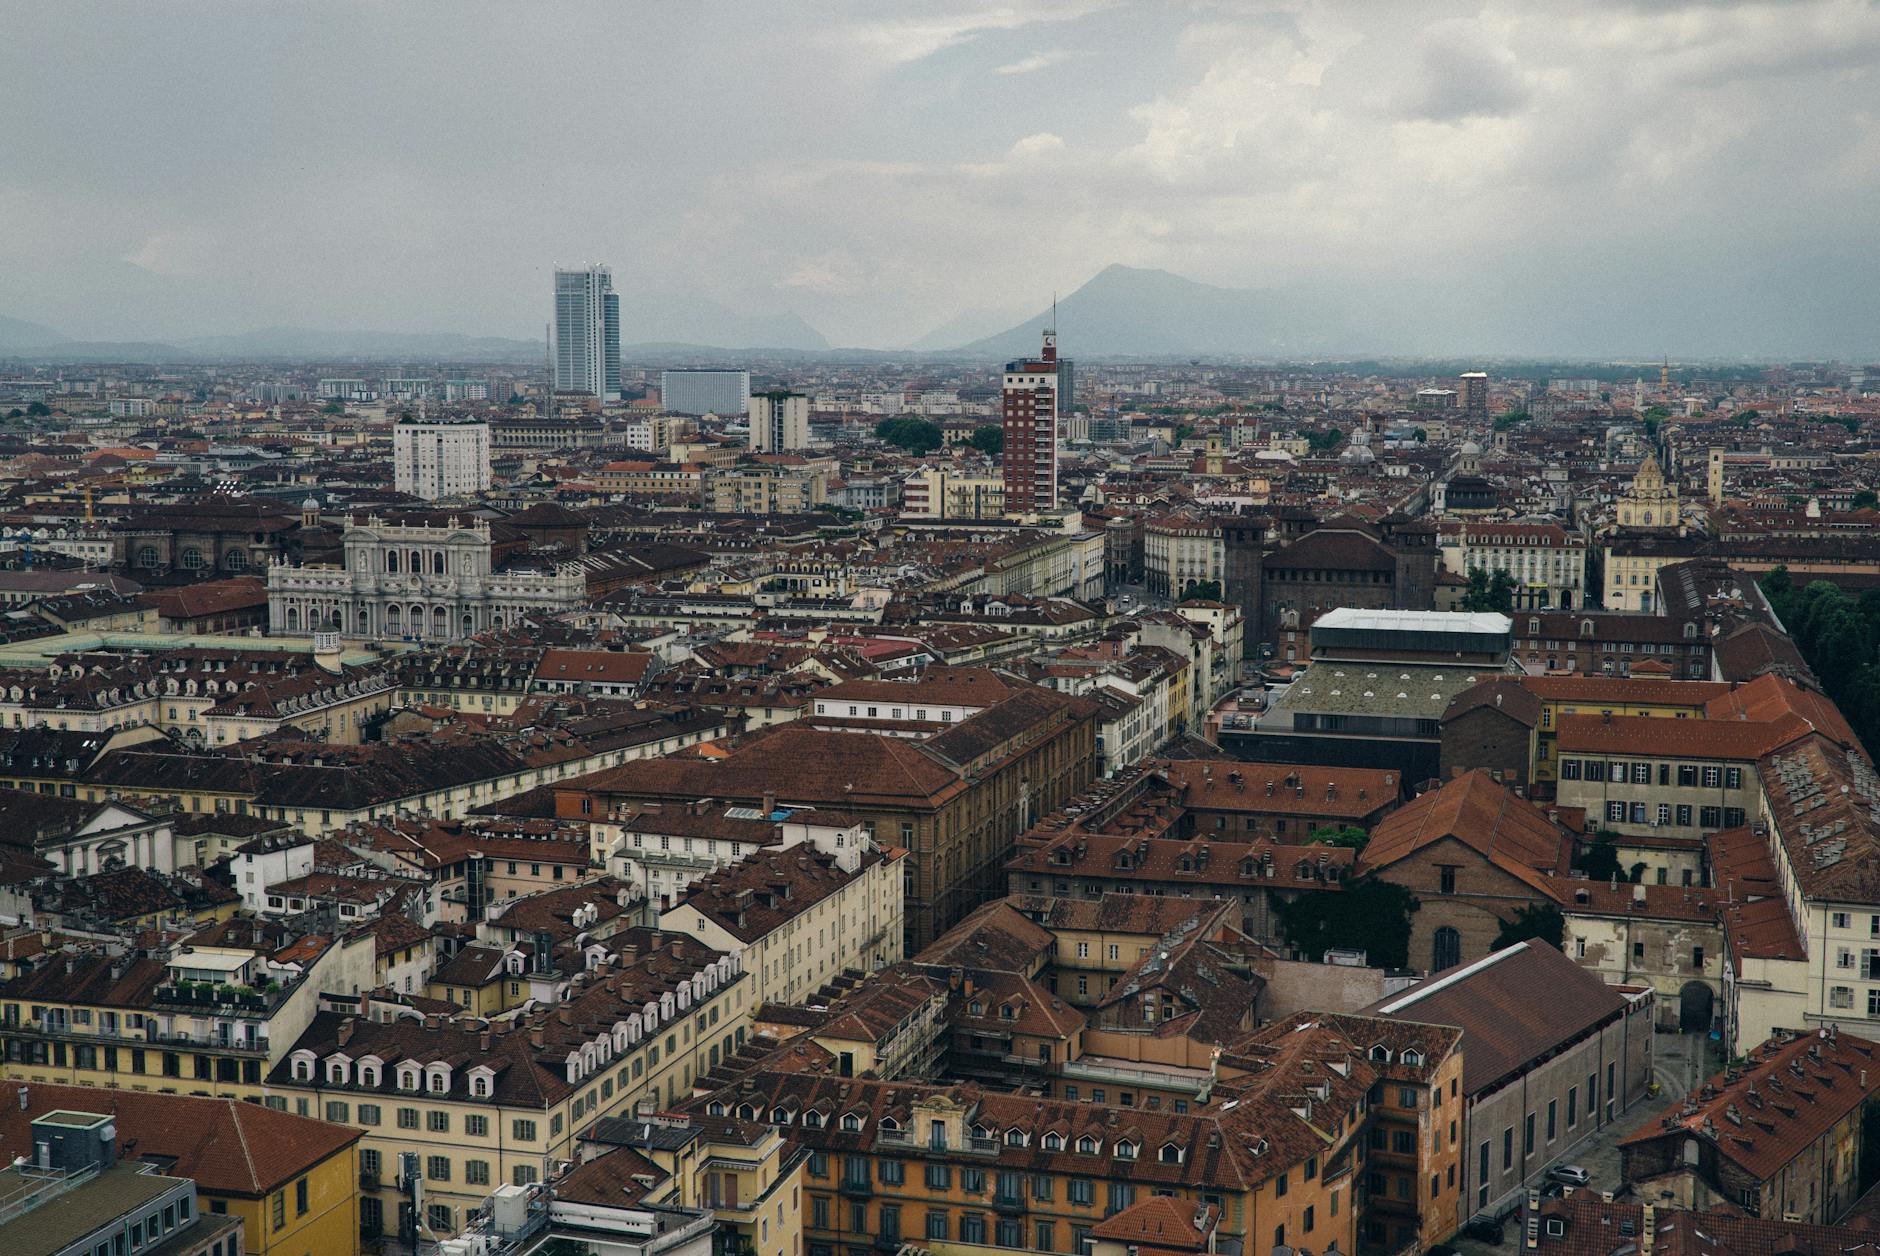
Turin is a vibrant city located in northern Italy, known for its rich history and elegant architecture. It serves as a major cultural and economic hub, blending traditional charm with modern innovation. Famous for its automotive industry and renowned museums, Turin offers a unique mix of art, culture, and industry. The city’s scenic setting along the Po River enhances its appeal as a dynamic destination.
Turin Key Statistics Overview
Turin Population Statistics
In 2025, Turin has a population of 853,196 with a stable trend, showing a slight decline of 0.5% over five years. This population trend lags behind Seville, which experienced a 0.1% growth, but is stronger than Cologne's significant decline of 5.6%. Turin covers an area of 130 km², resulting in a population density of 6,559 people per km². This density is 128% higher than other cities in the same country, including Milan and Naples, and 74% higher than the European average. Compared to European cities like Barcelona and Seville, Turin maintains a moderate density that supports good transit and walkability.
Population Over Time
Chart loading...
Population Density Over Time
Chart loading...
Turin Employment & Jobs Data
In 2023, Turin's unemployment rate was 8.2%, which is around the European average. However, the city's unemployment situation has been deteriorating faster compared to other Italian cities such as Rome and Naples, where unemployment rates decreased by 29.3% and 44.1% respectively. This indicates that Turin faces more challenges in reducing joblessness relative to these cities. The data highlights a need for focused efforts to improve employment opportunities in Turin.
Unemployment Rate Over Time
Chart loading...
Activity Rate Over Time
Chart loading...
Turin Tourism & Visitor Statistics
In 2024, Turin recorded 3,580,221 tourism nights, indicating moderate tourism activity. The city outperforms other Italian cities such as Rome, with 77.1% more tourism nights, and Naples, with 43.3% more. Compared to the European average, Turin shows a strong presence in attracting tourists. These figures highlight Turin's significance as a tourist destination within Italy. The city's tourism metrics suggest steady interest from visitors throughout the year.
Tourism Nights Over Time
Chart loading...
Turin Environment & Air Quality Data
Turin's PM10 concentration in 2013 was 36.7 µg/m³, which is above the WHO guideline but still within EU limits. The city has shown a greater improvement in reducing PM10 levels compared to other Italian cities such as Rome, which saw a 3.6% decrease, and Naples, which had no change. Despite these improvements, Turin's air pollution remains a concern when compared to the European average. The data indicates that Turin is making progress in managing air quality relative to other cities in Italy. Continued efforts are necessary to further reduce pollution levels.
Air Quality (PM10) Over Time
Chart loading...
Turin Statistics Summary
Turin stands out as a dynamic northern Italian city that successfully blends rich cultural heritage with industrial innovation, attracting a significant number of tourists annually. Despite a slight population decline and challenges in lowering unemployment rates, the city maintains a high population density that supports accessibility and urban vitality. Progress in improving air quality demonstrates Turin’s commitment to environmental health, positioning it as a vibrant and evolving destination with strong economic and cultural appeal.